Role and Responsibilities
- Review of problem statements generated from user interviews
- Application of UX frameworks (HEART & CASTLE)
- Development of top-level metrics
- Creation of measurement plans
- Implementation of tags and tracking setup in GA4, Google Tag Manager, and FullStory
- Designed metrics reporting around ease of understanding
- Presented report and methodology to multiple stakeholders across organization, including CEO and CPO
Scopes & Constraints
- 2 workers assigned for scope of entire system redesign
- Limited organizational knowledge of GA4 and other analytics & tracking methods
- Little direction provided beyond "figure out how to measure UX improvements”
- Worked concurrently with multiple projects
Timeframe
October 2023-December 2024
Problem
The Municipal Securities Rulemaking Board’s (MSRB) was in the middle of a $6 million modernization of Electronic Municipal Market Access (EMMA), its flagship municipal securities platform. Leadership needed credible evidence that the modernization was improving user experience—not only for internal decision-making, but also for executive leadership, the Board, and external stakeholders. Existing reporting focused almost entirely on operational and database metrics, leaving product leadership without meaningful evidence of user outcomes.
Define Success
My challenge wasn't simply to define UX metrics—it was to create a repeatable measurement system the organization could use long after the modernization project was complete.
Leadership's only direction was straightforward but highly ambiguous:
"Figure out how we measure UX improvements."
No framework existed, success metrics had never been defined, and there was limited organizational familiarity with modern analytics platforms. Before selecting tools or identifying KPIs, I first needed to establish what "success" actually meant for the modernization effort.
Rather than inventing new goals, I traced the project back to its original intent by analyzing the 38 research-derived problem statements and 19 planned enhancements that had guided the redesign from its inception. Working with product owners, developers, and stakeholders, I verified which improvements would actually be delivered at launch so that every future metric could be tied to a real product outcome rather than an assumption.
At the end of this exercise, we had something the project had never previously defined: a shared understanding of which user problems the modernization effort was intended to solve.
Select the Right Framework
With the project's intended outcomes established, the next challenge was determining how those outcomes should be measured.
Our initial exploration focused on Google's HEART framework because it is widely used for consumer-facing digital products. After evaluating it against EMMA's context, however, we concluded that HEART's emphasis on behaviors such as user growth and revenue made it a poor fit for a financial regulatory platform.
Instead, I led the effort to adopt Nielsen Norman Group's CASTLE framework, whose focus on learnability, task completion, and expert workflows more closely reflected how professionals actually use EMMA.
| HEART | CASTLE |
|---|---|
| Consumer products | Workplace applications |
| Growth | Task completion |
| Adoption | Learnability |
| Engagement | Expertise |
Rather than forcing the product into an inappropriate framework, we adapted our measurement strategy to fit the realities of the business.
Build a Scalable Measurement System
Once the framework had been established, I translated research findings into a measurement system that could operate at both tactical and executive levels.
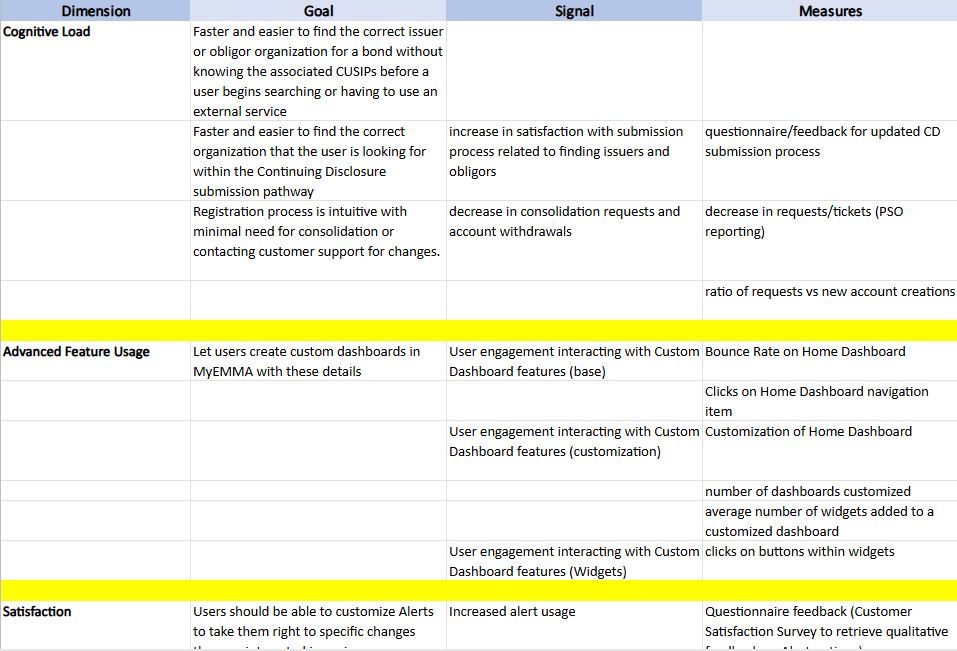
Beginning with the original problem statements, I identified 17 UX goals, 19 behavioral signals, and 35 measurable indicators spanning analytics, surveys, customer support data, and engineering metrics. These were synthesized into nine executive-level KPIs that leadership could use to monitor the overall success of the modernization effort while still allowing individual teams to investigate detailed supporting metrics.
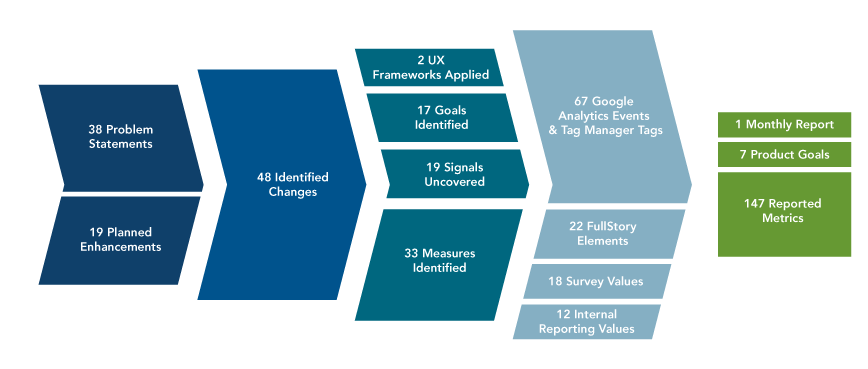
Rather than creating a dashboard for a single project, I intentionally designed the measurement hierarchy as reusable governance documentation so future teams could define, implement, and report UX metrics using the same methodology.
Operationalize the Data
A measurement strategy only provides value if teams can consistently collect and communicate the data.

Partnering with engineering and product teams, I implemented the measurement strategy across GA4, Google Tag Manager, FullStory, SurveyMonkey, Jira, and customer support reporting. I also designed layered reports that gave executives high-level KPIs while allowing product teams to explore supporting metrics.
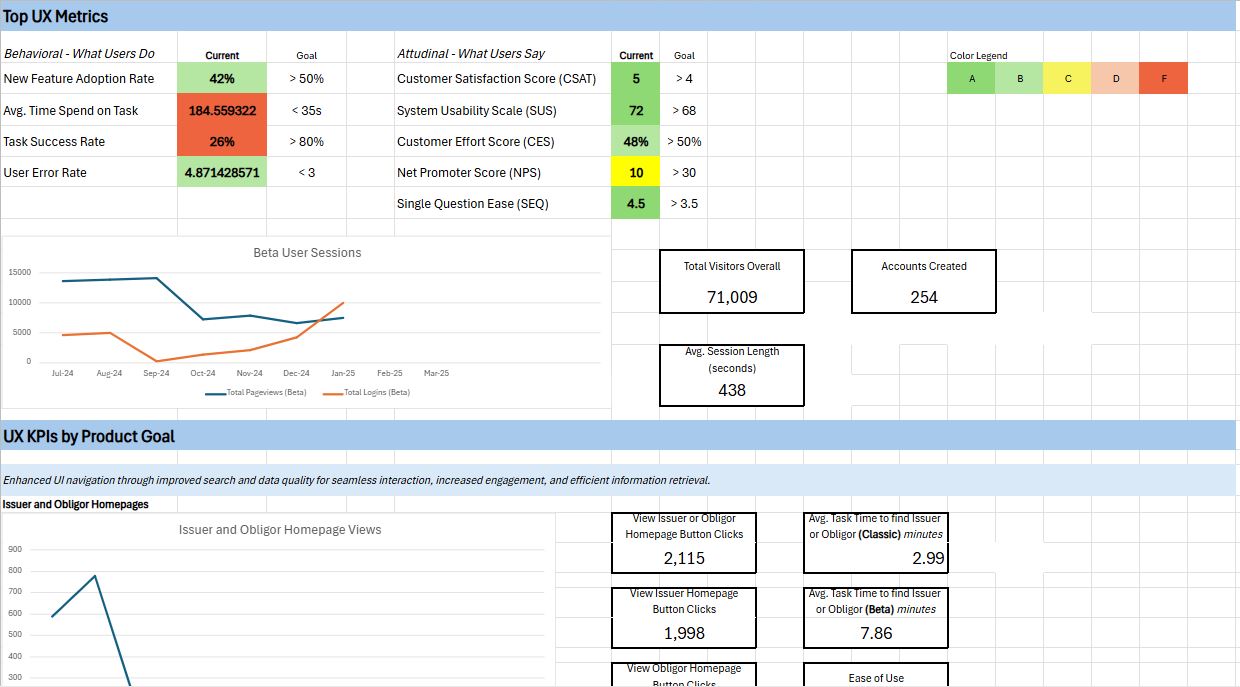
The monthly report with six months of data from the production and new platform test environments.
When the beta schedule unexpectedly compressed from several months to just a few weeks, I adapted the reporting cadence from monthly to weekly without disrupting the broader measurement framework, ensuring leadership continued receiving actionable feedback throughout testing.
Scale Organizational Adoption
The project's impact extended well beyond the modernization initiative.
After presenting the completed framework to the Chief Product Officer, I was asked to deliver a company-wide Lunch & Learn explaining both the methodology and the broader possibilities of UX measurement. What began as a solution for one modernization project became a catalyst for broader organizational adoption. Teams across the organization began applying the methodology to evaluate additional analytics opportunities, while product leadership incorporated UX measurement planning into future product development.
The most significant outcome wasn't the dashboard itself—it was establishing a repeatable process that future product teams could use to define and measure UX success from the beginning of a project.
Outcomes & Results
| Before | After |
|---|---|
| UX success discussed qualitatively | UX success measured through defined outcomes |
| Operational metrics only | Executive UX KPIs tied to research goals |
| No repeatable measurement process | Standardized UX measurement methodology |
| Success evaluated after launch | Measurements planned as part of product design |
The lasting value wasn't the dashboard itself—it was establishing an organizational capability for defining, measuring, and communicating UX success. Product teams shifted from evaluating success after launch to defining measurable user outcomes during the design phase, creating stronger alignment between research, design, engineering, and product management.
By the end of the project, the organization had moved from asking "How do we know if this redesign worked?" to having a standardized framework for defining, operationalizing, and communicating UX success.
Next case study: Reimagining Advanced Search for a Complex Financial Data Platform